
That single misunderstanding drives most buyer confusion, bad model comparisons, and inflated electricity bills that could have been avoided.
This article explains what "power consumption in watts" actually means for a 1.5 ton inverter AC, what the realistic operating range looks like based on manufacturer data, the factors that push consumption higher or lower in real Indian conditions, and the most common misconceptions that lead buyers to the wrong conclusions.
Key Takeaways
- A 1.5 ton inverter AC draws 400–615W at steady state and 1,210–1,840W during active cooling, depending on the model and ambient conditions
- ISEER, not star category, is the right metric for comparing efficiency between models
- Each degree set below 24°C increases energy consumption by approximately 6%, per BEE guidance
- "1.5 ton = 1,500 watts" is a common misconception: tonnage measures cooling capacity, not electrical input
- Dirty filters can raise energy consumption by 5–15%; actual consumption is best verified with a real-time energy monitor
What Power Consumption in Watts Actually Means
Tons vs. Watts — They're Not the Same Thing
The single most persistent misconception about AC wattage starts with the word "ton." One refrigeration ton equals 12,000 BTU/hr of cooling — a unit defined by ASHRAE based on the rate at which a block of ice melts, not electrical power. A 1.5 ton AC therefore delivers 18,000 BTU/hr (approximately 5.275 kW) of cooling capacity. That is the heat being removed from the room, not the electricity being drawn from the wall.
The electrical input needed to achieve that cooling depends entirely on efficiency. A less efficient model needs more watts to move the same amount of heat; a more efficient one needs fewer. That relationship is captured by the ISEER rating.
What ISEER Actually Measures
ISEER (Indian Seasonal Energy Efficiency Ratio) is defined by BEE as:
ISEER = Cooling Seasonal Total Load ÷ Cooling Seasonal Energy Consumption
BEE calculates this across 1,600 hours of simulated seasonal operation, spanning outdoor temperatures from 24°C to 43°C. The result tells you how many units of cooling are delivered per unit of electricity consumed over a full Indian season — not just at one test point. A higher ISEER means the compressor draws fewer watts to deliver the same cooling — which is exactly what drives your monthly bill up or down.
Why Wattage Is a Moving Target in Inverter ACs
A fixed-speed AC runs at full power or switches off — nothing in between. An inverter AC's compressor adjusts its speed continuously based on the actual cooling demand at that moment.
The difference in practice:
- Full-speed mode: When the room is far from the set temperature, the compressor runs fast and draws peak watts
- Maintenance mode: Once the room reaches the set point, it slows to a fraction of rated speed and draws far less power
- Real-world average: The actual wattage your AC draws sits somewhere between these two extremes — weighted by how often it cycles through each
This is why inverter ACs cut electricity bills compared to fixed-speed models. It's also why there is no single "running wattage" to quote. The number that matters is the weighted average across your usage pattern — and that's what the next section breaks down.
Typical Wattage Range: What a 1.5 Ton Inverter AC Actually Draws
Nominal Operating Range
Real manufacturer data gives the clearest picture. Based on published 2025 specifications from Daikin and Blue Star:
| Model | Star Rating | ISEER | Rated/Full Load | 50% Load | Annual kWh |
|---|---|---|---|---|---|
| Daikin FTKR50UV16U | 5-star | 5.20 | 1,325 W | 460 W | 785.67 kWh |
| Daikin FTKL50U | 3-star | 4.00 | 1,670 W | 554 W | 966.47 kWh |
| Blue Star IC718DCUHD | 5-star | 5.41 | 1,250 W | 449 W | 754.85 kWh |
| Blue Star IC318MNU | 3-star | 3.81 | 1,685 W | 615 W | 1,026.46 kWh |
| Blue Star IA518DXU (2026) | 5-star | 5.70 | 1,210 W | 400 W | — |
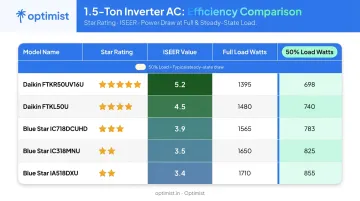
The 50% load figures — 400 to 615W depending on model and star rating — represent steady-state draw once the room has reached the set temperature. This is where a well-sized inverter AC in a properly insulated room spends most of its operating time.
During active pull-down (room significantly above set temperature), draw rises to the rated/full-load range: roughly 1,210–1,685W for current models.
Peak Draw and the Startup Phase
The compressor runs hardest during the initial pull-down phase or when outdoor temperatures are extreme. Published Daikin maximum draw figures are 1,639W for the 5-star FTKR and 1,840W for the 3-star FTKL — confirming that peak draw can exceed the rated wattage.
The compressor can operate at these peak levels for short periods, but sustained operation at maximum speed:
- Raises average consumption well above its BEE star-rated average
- Increases compressor wear over time
- Signals that the unit may be undersized for the space or conditions
The 3-Star vs. 5-Star Annual Difference
How a unit behaves at peak load feeds directly into annual costs. The ISEER gap between star categories has a measurable rupee impact — here's what same-brand 2025 label data shows:
- Blue Star comparison: 5-star (754.85 kWh) vs. 3-star (1,026.46 kWh) = 271.61 kWh/year difference
- Daikin comparison: 5-star (785.67 kWh) vs. 3-star (966.47 kWh) = 180.80 kWh/year difference
At a marginal tariff rate of ₹8/unit — Maharashtra's FY2026-27 order lists charges from ₹3.96/kWh to ₹10.80/kWh depending on consumption slab, so substitute your local rate — that Blue Star gap translates to roughly ₹2,173/year in savings by choosing the 5-star over the 3-star.
Models with higher ISEER ratings spend more time at low watt draw — the 50% load range shown in the table above. Optimist's 1.4 Ton 5 Star+ (ISEER 6.05, India's highest rated AC) pulls just 400W at steady state and 1,070W at full load, meaning it operates toward the low end of the draw spectrum for more of the day. That sustained low-draw operation is where seasonal bill savings actually accumulate.
What Drives Power Consumption Variation in Real-World Use
Thermostat Setting and Compressor Speed
Set temperature is the most immediate lever a homeowner controls. BEE states that raising the AC set-point by 1°C saves approximately 6% of electricity. The Ministry of Power recommends 24°C as the default, noting that moving from 20°C to 24°C could save around 24% based on the same 6%-per-degree relationship.
In practical terms: setting your AC to 20°C instead of 24°C forces the compressor to run faster and sustain higher wattage for longer. The cooling sensation difference is marginal for most people; the bill difference over a summer is not.
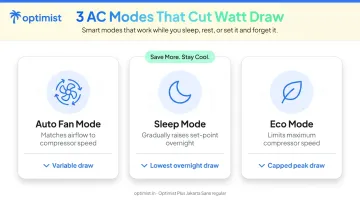
Modes that help:
- Auto fan mode — adjusts airflow to match compressor speed, reducing wasted fan energy
- Sleep mode — gradually raises the set-point through the night, reducing compressor speed
- Eco mode — limits maximum compressor speed, keeping watt draw toward the lower end of the range
Outdoor Temperature and Ambient Load
BEE tests ISEER across a 24°C–43°C outdoor temperature range. The 35°C test point is the rated reference — but Indian summers routinely exceed it. IMD data from May 2024 recorded temperatures of 45–48°C across Rajasthan, Haryana, Delhi, and Vidarbha, with Sri Ganganagar reaching 48.3°C.
At higher outdoor temperatures, the temperature differential between inside and outside widens. The compressor works harder to push heat against that gradient, drawing more watts and sustaining that higher draw for longer before the room stabilises.
The same AC model draws noticeably more watts on a 46°C Delhi afternoon than on a 32°C Bangalore morning. The BEE label annual kWh figure does not fully capture this gap: it is calculated over a simulated seasonal distribution, and Down to Earth reports that 1,100 of the 1,600 seasonal hours are at 30°C or below, meaning the label may understate consumption for households in consistently hot northern climates.
Maintenance and Degradation
Two maintenance issues directly affect sustained wattage:
Dirty filters — The US DOE states that cleaning or replacing air filters can lower AC energy consumption by 5–15%. Clogged filters restrict airflow, reducing the evaporator's ability to absorb heat from the room. The compressor runs longer and faster to compensate.
Low refrigerant charge — ASHRAE notes that refrigerant leakage lowers system capacity and can prevent the system keeping up at high load. An undercharged system delivers less cooling per compressor cycle, forcing the compressor to run continuously to chase a target it cannot reach. The result is sustained elevated watt draw and a spike in electricity bills that most homeowners cannot explain.
That last scenario is where real-time monitoring changes the equation. The Optimist App's built-in gas level indicator — India's first — shows refrigerant charge status continuously, letting homeowners detect a developing leak before it shows up as a higher electricity bill or an emergency service call.
How to Measure and Verify Actual Consumption
What the BEE Label Actually Shows
The annual kWh figure on the BEE label is calculated across 1,600 standardised seasonal hours — it is a model comparison tool, not a household bill prediction. To find an approximate average watt-equivalent, divide the annual kWh by 1,600:
Example: A model rated at 785 kWh/year implies a seasonal average of roughly 490W — weighted across its full cycle, including long stretches at low compressor speed.
That is not the wattage the AC draws at any given moment — it's a weighted seasonal average that includes all the hours at low compressor speed.
Measuring at Home
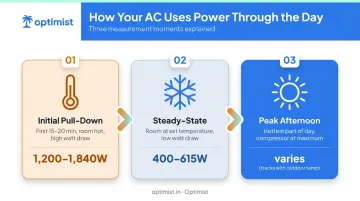
To understand your AC's actual consumption profile, take readings at three operating points:
- Initial pull-down — first 15–20 minutes after switching on in a hot room
- Steady-state — once the room has reached set temperature and stabilised
- Peak afternoon — during the hottest part of the day when the compressor is working hardest
A clamp meter (such as the Fluke 345) on the supply cable gives accurate true-power readings. For Optimist units, the Optimist App handles this automatically: instantaneous kW draw, cumulative kWh for the billing cycle, and projected monthly bill in rupees — no additional hardware needed.
Field measurements show ±20–30% variation from the BEE-rated annual equivalent, depending on your local climate, usage hours, thermostat settings, and room conditions. That range is expected — use the BEE figure to compare models, and your meter readings to track actual spend.
Common Misconceptions About 1.5 Ton Inverter AC Wattage
"1.5 ton = 1,500 watts"
The most widespread myth. Tonnage is a cooling capacity unit — 1.5 ton means 18,000 BTU/hr of heat removed from the room. It has no direct relationship to electrical input. A 1.5 ton 5-star inverter AC at rated conditions might draw 1,210–1,325W; a 3-star model at the same cooling output might draw 1,670–1,685W. The wattage depends on efficiency, not on the tonnage number.
"The BEE label shows what my AC draws per hour"
The label shows annual energy consumption under standardised test conditions — not an instantaneous draw figure. An inverter AC's actual hourly draw shifts continuously from ~400W to ~1,800W depending on load. The "per hour" framing only makes sense as a session average, and even that varies significantly by day, season, and usage pattern.
"Same star rating = same efficiency"
Under the current 2026 BEE bands, 5-star requires ISEER ≥ 5.60. But two 5-star ACs can have materially different ISEER values — for example, 5.70 (Blue Star IA518DXU) vs. a model at exactly 5.60. The numeric gap between two 5-star models can be larger than the gap between a 4-star and a 5-star unit. Optimist's 1.4 Ton 5 Star+, for instance, carries an ISEER of 6.05 — measurably above the 5-star minimum — which translates to fewer average watts consumed per cooling cycle. Always check the actual ISEER figure on the BEE label, not just the star count.
Frequently Asked Questions
How many watts does a 1.5 ton inverter AC consume?
A 1.5 ton inverter AC draws 400–615W at steady state and 1,210–1,840W during active pull-down, based on published 2025 manufacturer data. The session average depends on the model's ISEER rating, outdoor temperature, and thermostat setting.
Can I use a 1.5 ton AC for a 200 sq ft room?
A 1.5 ton AC is designed for 150–180 sq ft under normal conditions. For 200 sq ft, it can work with good insulation and standard heat load — but if the heat load is high, the unit runs at sustained higher wattage, cutting into efficiency and raising running costs.
Can a 1.5 ton AC run on a 1 kW supply?
No. A 1.5 ton inverter AC draws 1,200–1,840W during active cooling — well beyond a 1 kW supply, which will trip the circuit at startup. Only at steady state (~400–600W) does consumption drop near 1 kW, but that phase comes after the pull-down.
What is ISEER and how does it affect watts consumed?
ISEER measures how many units of cooling are delivered per unit of electricity consumed across a simulated Indian season. A higher ISEER means fewer watts needed per hour of cooling — a model with ISEER 6.05 consumes noticeably less electricity for the same cooling output than a model at ISEER 4.00, assuming the same usage conditions.
Why does my 1.5 ton inverter AC use more electricity in summer?
At outdoor temperatures above 38–40°C, the compressor must overcome a larger temperature differential to push heat outside. It runs at higher speeds for longer periods, increasing watt draw well above the BEE test conditions measured at 35°C — which is why peak-summer bills are always higher than the label's annual average implies.
What is the difference between rated watts and actual watts for an inverter AC?
The BEE label shows annual energy consumption under standardised test conditions, not a real-time watt figure. Actual draw varies minute-to-minute from minimum to peak. Field measurements — using a clamp meter or the Optimist app's built-in energy monitor — typically show higher average consumption than the label implies, particularly in hotter climates or with longer daily usage.